![]()
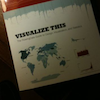
Visualize This is a practical guide on visualization and how to approach real-world data.

About
A book by Nathan Yau who writes for FlowingData, Visualize This is a practical guide on visualization and how to approach real-world data. The book is published by Wiley and is available on Amazon and other major online booksellers.
Table of Contents
Ch. 1 — Telling Stories with Data
Ch. 2 — Handling Data
Ch. 3 — Choosing Tools to Visualize Data
Ch. 4 — Visualizing Patterns over Time
Ch. 5 — Visualizing Proportions
Ch. 6 — Visualizing Relationships
Ch. 7 — Spotting Differences
Ch. 8 — Visualizing Spatial Relationships
Ch. 9 — Designing with a Purpose
There are lots of books on visualization that describe best practices and design concepts, but what do you do when it comes time for you to actually make something?
If you don't know how to use the software in front of you, the abstract isn't all that useful. And with growing amounts of data, it's becoming more important to be able to make sense of and communicate with it all.
In Visualize This, Nathan Yau teaches you how to create graphics that tell stories with real data, and you'll have fun in the process. Learn to make statistical graphics in R, design in Illustrator, and create interactive graphics in JavaScript and Flash & Actionscript.
Yau draws from his experience as a graduate student in statistics and his work with major news organizations for an engaging, data-first approach. After all, visualization is about the data it's based on.
Chapters group examples and tutorials by data type and take you through the process of data exploration and analysis, to visuals, and finally, to a graphic that is fit for publication for print and online.
Read the book cover-to-cover, or keep it on your desk as a reference for your data projects. Pages are in full color with tons of graphics to inspire and to help you learn visually.
What others are saying...
- The @FlowingData book has arrived! Even better than the blog, if that's possible.
- @flowingdata has produced an incredible book called Visualize This. If you like data visualization, go and get it
- YAY!! After MONTHS of waiting, just received my "Visualize This" book by Nathan Yau (@flowingdata), quick browse: very much worth the wait :)
- reading Visualize This (kindle version) Fantastic read, amazing work Nathan @flowingdata thought I might need paper v, but kindle v = great
- taking @nathanyau's @flowingdata's book 'Visualize This' to bed with me. It's that good and I'm that geeky.
- Just read the first few chapters of Visualize This. Great read. Gonna get a place next to my Tufte books.
- "Visualize This" reads like a love letter to python, r, maps, and data. Thanks @flowingdata
- @flowingdata Great book but you kept me up too late reading! There goes my week-end.
- @flowingdata got my copy of #visualizethis : beautiful, insightful and inspiring #thankyou
- Awesome day, but now I want to play sick tomorrow. Why? So I can spend all day with @flowingdata's book