![]()
In Data Points, learn the process of understanding, exploring, and visualizing data.

About
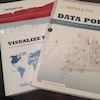
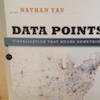
In his bestselling book Visualize This, Nathan Yau introduced you to the tools and programming techniques for visualization. Now, in Data Points, he explores the thinking process that helps you create original, meaningful visualization. Start with the data and build.
Table of Contents
Chapter 1 — Understanding Data
Chapter 2 — Visualization: The Medium
Chapter 3 — Representing Data
Chapter 4 — Exploring Data Visually
Chapter 5 — Visualizing with Clarity
Chapter 6 — Designing for an Audience
Chapter 7 — Where to Go from Here
Download Sample ChapterVisualization is often approached within a rigid framework of design rules and principles. We tend to think of it as charts that have been optimized for graphical perception and anything that sits outside the framework must not work. This notion is outdated.

Visualization has developed into a medium that is used for analysis, presentation, and storytelling (of all sorts), which requires a more flexible approach to data.
In Data Points, you start with the data — what it is and what it represents. This makes for visualization that is more meaningful and useful to a wide audience because you understand the data better. The more you know about the data, the better you can explain and present it to others.
What others are saying...
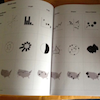
- Data Points by @flowingdata is a gorgeous and inspiring collection. So much goodness.
- Can already tell it's gonna be great. Beautiful full bleed graphics. Congrats @flowingdata @nathanyau on its success!
- Enjoying outstanding new book on data visualization, "Data Points" by Nathan Yau
- Really enjoyed Data Points, @nathanyau's latest book.
- Data Points, @flowingdata's latest book looks beautiful and informative
- Got my #DataPoints book by @flowingdata today! Another great #dataviz effort, Nathan! Excellent work!
- Nathan Yau's @flowingdata new book "Data Points" is an excellent guide to thoughtfully use data in visualization.
- Have been delaying pleasure Slowly reading Received Visualize This and Data Points.These 2 are beautiful! Nice job @flowingdata!
- Nathan Yau's @flowingdata new book "Data Points" is an excellent guide to thoughtfully use data in visualization.
- This book is an inspiration tool to think outside the box of single data points.