Global Economic Dynamics, by the Bertelsmann Foundation in collaboration with 9elements, Raureif, and…
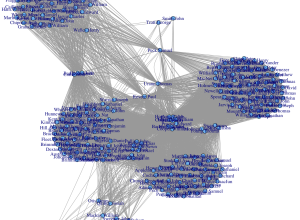
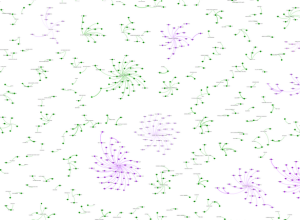
Network Visualization
Fun with links, nodes, and edges.
-
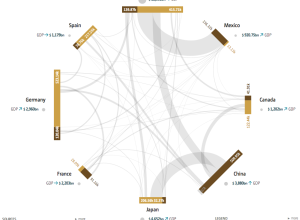
Global migration and debt
-
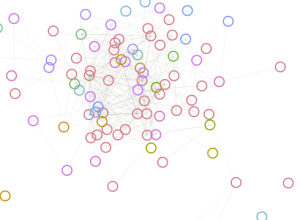
A people-centric view of your Gmail inbox
Immersion by the MIT Media Lab is a view into your inbox that…
-
Sniffing out Paul Revere with basic social network analysis
It’s just metadata. What can you do with that? Kieran Healy, a sociology…
-
Link
Making the game of thrones visualization
Jerome Cukier describes the process behind making his Game of Thrones interactive.
-
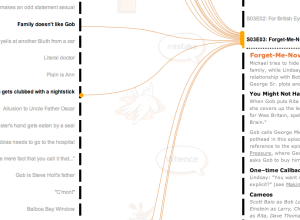
An exploration of recurring jokes on Arrested Development
Watch Arrested Development enough and you start to realize there are a lot…
-
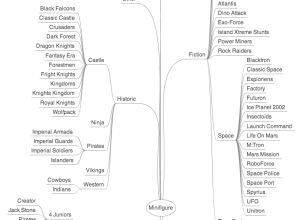
Lego minifigure taxonomy
There are over 4,000 Lego minifigure characters ranging from plumbers and judges to…
-
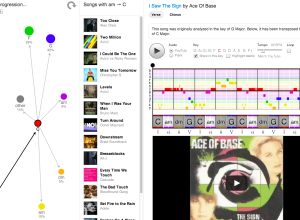
Interactive: Common chord progressions in 1,300 songs
If you listen to the radio long enough, you’ve probably noticed that many…
-
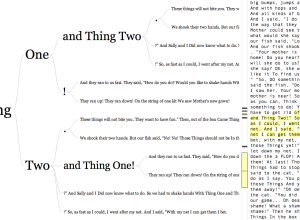
Word tree for any URL or Twitter username
In 2007, Martin Wattenberg and Fernanda Viégas created the word tree, a search…
-
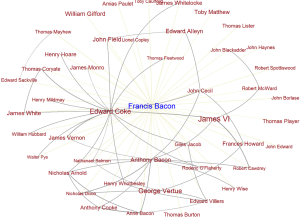
Six Degrees of Francis Bacon, a 17th century social network
These days it’s relatively easy to figure out connections between people via email,…
-
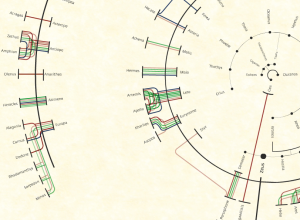
The many relationships of Zeus
Viviana Ferro, Ilaria Pagin, and Elisa Zamarian had a look at all of…
-
Wine industry network in the US
A group of researchers at Michigan State University, led by Phil Howard, explored…
-
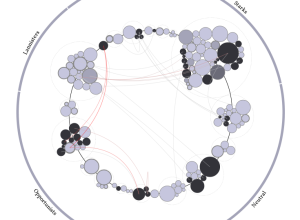
Animated growth of an organization
A company grows, it shrinks, people come and go. Justin Matejka, a research…
-
An introduction to diagrams
As a teaser for a larger project on diagrams, Jane Nisselson describes how…
-
An ideal bookshelf
Thessaly La Force, with illustrator Jane Mount, recently published My Ideal Bookshelf, which…
-
Relationships and kills in Game of Thrones replayed →
This one’s for you Game of Thrones fans and aficionados. Jerome Cukier visualized…
-
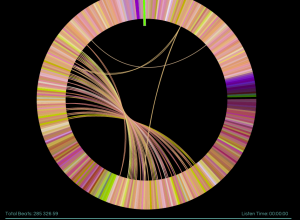
Infinite Jukebox plays your favorite songs forever
You know those songs that you love so much that you cry because…
-
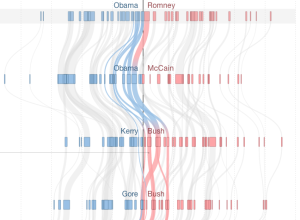
Shifting states over the decades, between Democrat and Republican →
Mike Bostock and Shan Carter visualized how states have shifted parties over the…
-

How viral photos spread on Facebook
Number of likes and shares for a Facebook post are just simple aggregates…
Recently for Members
Second Edition
 Visualize This: The FlowingData Guide to Design, Visualization, and Statistics (2nd Edition)
 Visualize This: The FlowingData Guide to Design, Visualization, and Statistics (2nd Edition)
New tools, refined process.
Browse by Chart Type See All →


