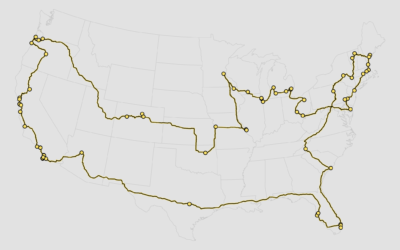
In the continued series of meta-data-driven maps, OpenStreetMap shows the work of individuals across the online community.
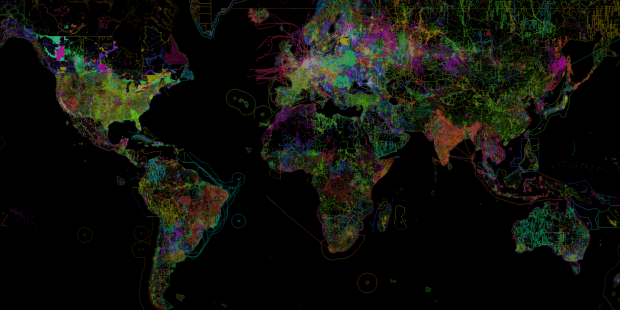
OpenStreetMap is created every day by thousands of users logging in and improving the map. Here is a visualization of this amazing social fabric of individuals working together. We generated a color for each road segment from the user ID of the mapper who last edited it to show how many individual contributions large and small add up to a collaborative map of the world. Take a look at how many people have been mapping near you.
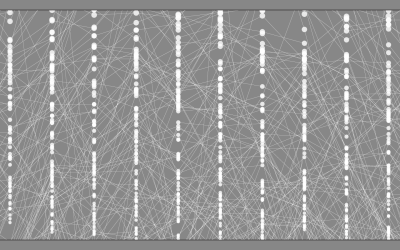
Areas that resemble a Pollock painting represent many contributors in a single area, whereas more solid colors represent uploaded databases and more major contributors.
Be sure to see the full-sized interactive version.