Many of you now have Visualize This in your hands and have probably…
2011 August
-
Flowing Datathon updates
-
Best of FlowingData – July 2011
With the launch of Visualize This, July was a fun month. On the…
-
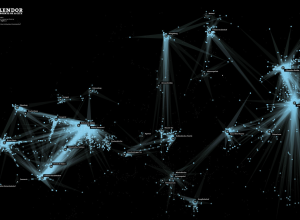
Digital spotlights on landmarks
Think about when you take a picture of something. It’s kind of like…
-
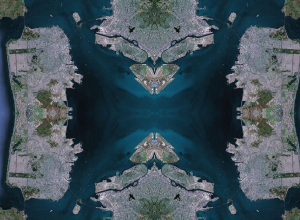
Maps as kaleidoscope in Rorschmap
Maps aren’t just a way to see directions from point A to point…
Recently for Members
Second Edition
 Visualize This: The FlowingData Guide to Design, Visualization, and Statistics (2nd Edition)
 Visualize This: The FlowingData Guide to Design, Visualization, and Statistics (2nd Edition)
New tools, refined process.
Browse by Chart Type See All →


