No, this isn’t a bad fungus spreading northwest towards Washington. This map from…
2009 July
-
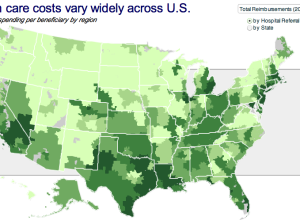
Health Care Costs Vary Widely By Region
-
Sneak Peek: New Version of your.flowingdata Coming Soon
The brand new version of your.flowingdata (YFD) is coming soon, and of course,…
-
Colored Tree, Cookies, and Stairs in Visualization Ad
These ads for Hospital Alemán from Saatchi & Saatchi color code physical items…
-
Is the Economy Getting Ready to Turn Around?
Is the economy going to turn around any time soon? How does this…
-
Realtime Information Graphics Show International Data Interchange
Zum Kuckuck, a design group in Germany, visualizes data interchange and network traffic…
-
Who’s Going to Win Nathan’s Hot Dog Eating Contest?
It’s July 4 this weekend. You know what that means, right? It’s Independence…
-

X-Men Universe Relationship Map
Contrary to what a lot people might think they know from the movies,…
Recently for Members
Second Edition
 Visualize This: The FlowingData Guide to Design, Visualization, and Statistics (2nd Edition)
 Visualize This: The FlowingData Guide to Design, Visualization, and Statistics (2nd Edition)
New tools, refined process.
Browse by Chart Type See All →


